
sailbuoy-2016-map-and-data.png
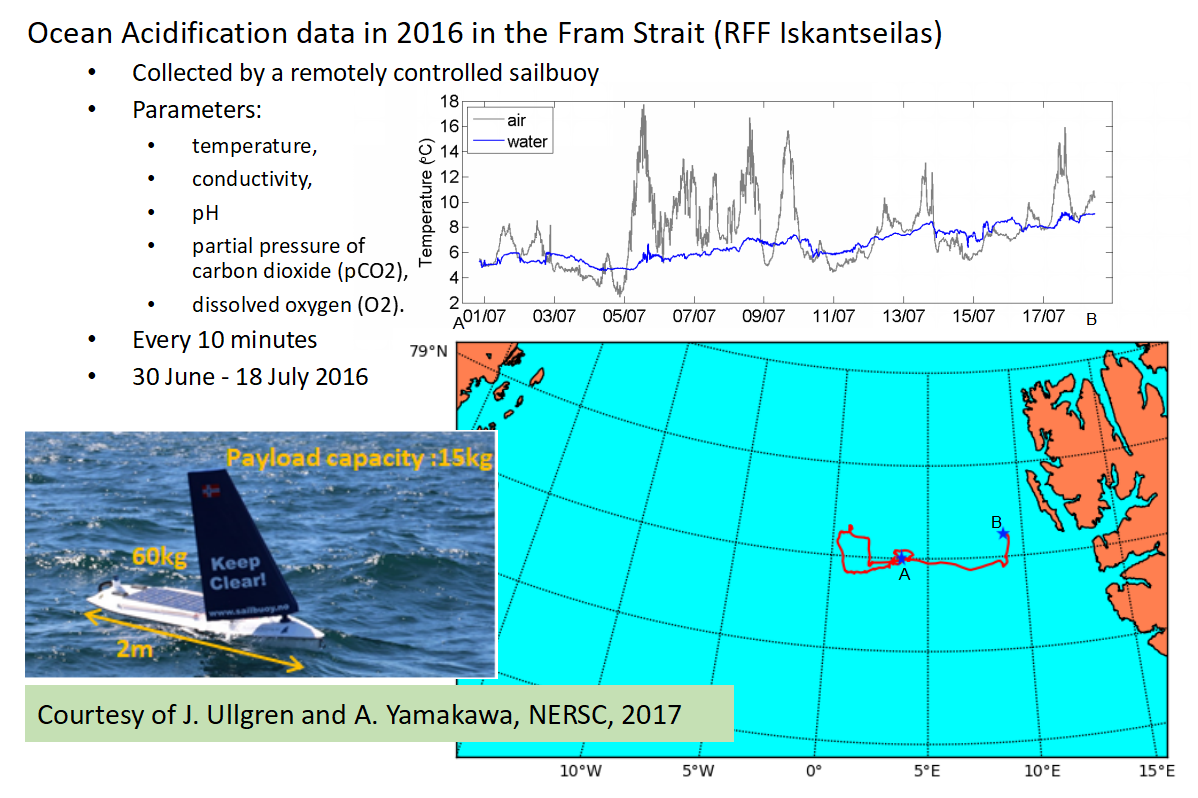
The sensors on the sailbuoy was collecting a set of ocean acidification parameters during a period of near 3 weeks in the summer of 2016. The map shows the path of the two sailbuoys used in the field experiment.
Additional Information
| Field | Value |
|---|---|
| Data last updated | November 19, 2018 |
| Metadata last updated | November 12, 2018 |
| Created | November 12, 2018 |
| Format | PNG |
| License | Creative Commons Attribution |
| Has views | True |
| Id | 54d1f679-7749-45f1-9a7f-5c87b4b84118 |
| Mimetype | image/png |
| On same domain | True |
| Package id | 05bd4b73-a402-4175-98f1-401db9d9ebcd |
| Size | 437.3 KiB |
| State | active |
| Url type | upload |