
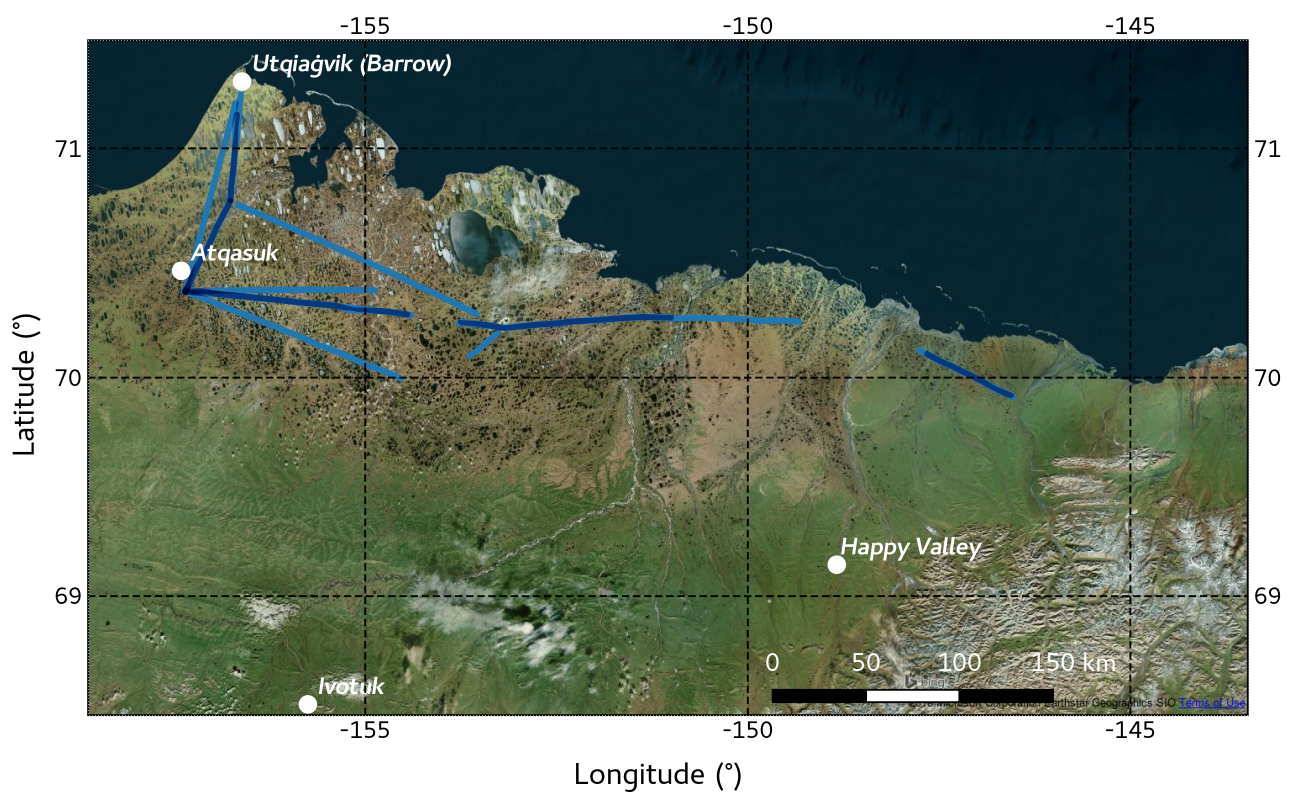
Fig. 1: AIRMETH_2012_flighttracks_Alaska_North_Slope
Fig. 1 shows the flight tracks of the AIRMETH campaign across the North Slope of Alaska in 2012 during which the greenhouse gas and heat fluxes were measured (the darker the shade of blue, the higher the repetition rate of the flight track).
Additional Information
| Field | Value |
|---|---|
| Data last updated | November 24, 2018 |
| Metadata last updated | November 24, 2018 |
| Created | November 24, 2018 |
| Format | PNG |
| License | Creative Commons Attribution Share-Alike |
| Has views | True |
| Id | 592892ee-1d8c-4b41-a606-3d51c465f441 |
| Mimetype | image/png |
| On same domain | True |
| Package id | 8ae42657-fe8d-4953-ad3b-889066ea4c0e |
| Size | 1.2 MiB |
| State | active |
| Url type | upload |