
NorCPM sea ice thickness assimilation statistics
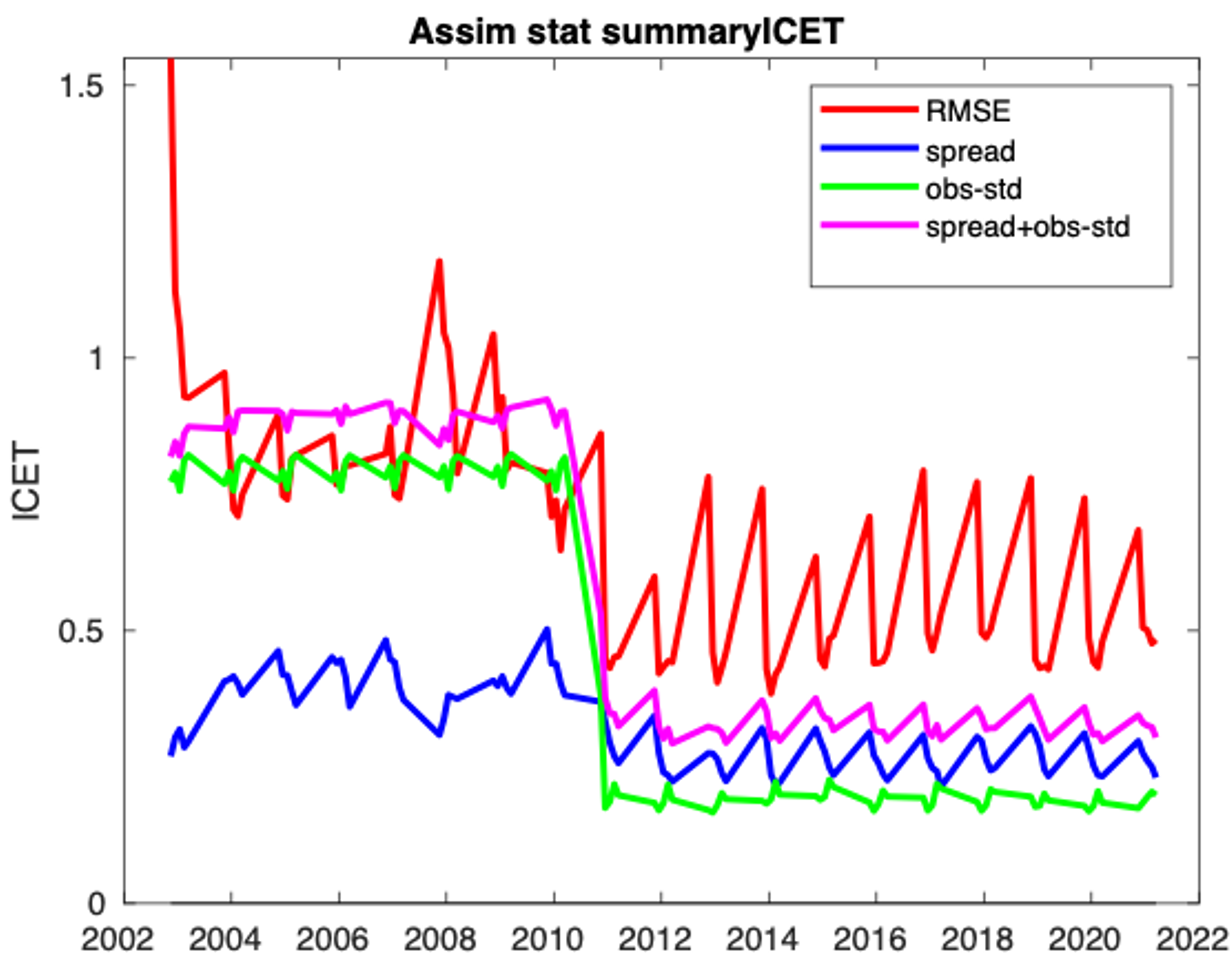
Sea ice thickness as result of assimilation diagnostic of the reanalysis with assimilation of SIT. The red line is the RMSE vs assimilated data before analysis, the green line is the observation standard deviation (in meter). The blue line is the ensemble spread (model uncertainty). The magenta line is the estimated total error (which is √(〖spread〗^2+〖obs_std〗^2). (Source: INTAROS Deliverable 6.11 Climate model initialization (V2) Final report on the added value of using data from INTAROS)
Additional Information
| Field | Value |
|---|---|
| Data last updated | February 9, 2022 |
| Metadata last updated | February 9, 2022 |
| Created | February 9, 2022 |
| Format | PNG |
| License | Creative Commons Attribution |
| Has views | True |
| Id | 11211329-827c-45c7-a921-697a998242d4 |
| Mimetype | image/png |
| On same domain | True |
| Package id | 5d18351f-8332-47c7-930c-3676e4f7cc39 |
| Size | 275.7 KiB |
| State | active |
| Url type | upload |